Company name
Elsewedy Polymers
Industry
Petrochemical / Masterbatch Manufacturing
Production Lines
4 production lines
Solution Deployed
Beedigit MES — Real-Time Monitoring, OEE & KPI Analytics, Oracle Integration
Timeline
2024–2025

From Paper Logs to Real-Time Data: How Elsewedy Polymers Digitized 4 Production Lines

100% of shift logs are now digitized. 5+ KPIs are tracked live, across all 4 production lines — replacing handwritten reports and end-of-shift guesswork.

BEEDIGIT's machine monitoring dashboard showing detailed performance metrics for individual equipment with real-time status indicators and historical trend comparisons
See the full results ↓

100%

of shift logs now digitized

4

production lines tracked live

5+

KPIs monitored in real time

1

unified Oracle-integrated dashboard

0

more paper-based downtime logs

The Challenge: Paper-Based Process

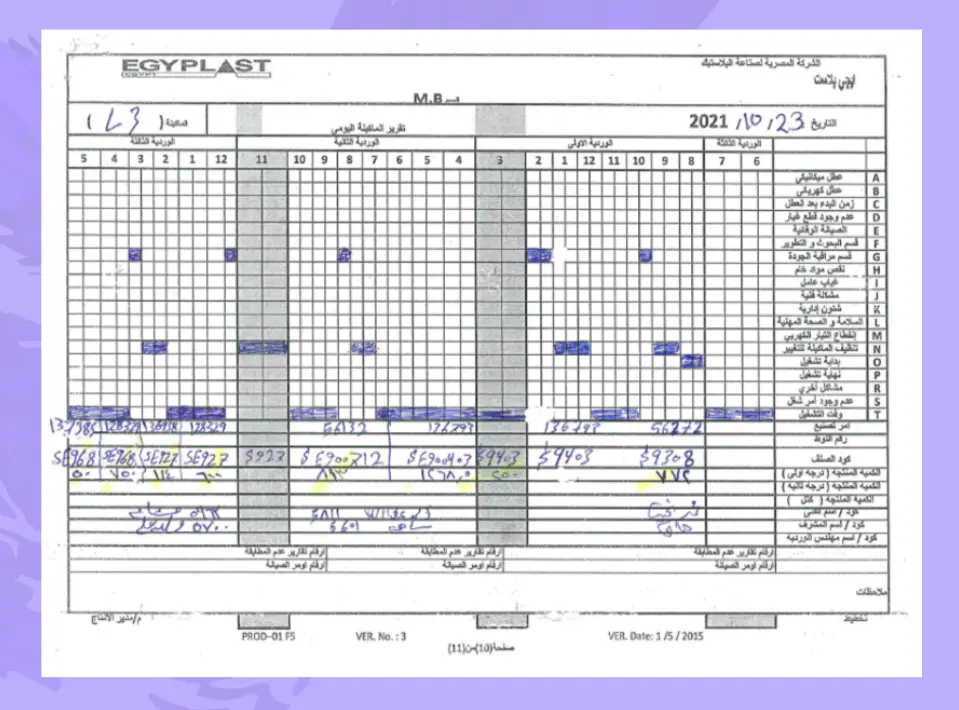
Before Beedigit, Elsewedy Polymers tracked downtime, machine parameters, and production orders entirely on paper. Downtime events were logged by hand, in inconsistent formats, often with illegible handwriting and missing timestamps. There was no standardized way to identify root causes. Reports relied on operator memory rather than actual machine events, and nobody could act on a problem until the shift was already over. Process parameters like temperature, speed, and pressure were hand-written per shift, with no validation or alerts. Production orders were issued on printed forms, then manually re-entered into Excel and Oracle ERP — adding redundancy, delay, and error at every step. Without visibility into real equipment performance and actual production capacity, the factory had no way to identify where to improve, or to justify investment in process upgrades.

BEEDIGIT's machine monitoring dashboard showing detailed performance metrics for individual equipment with real-time status indicators and historical trend comparisons

Illegible Records

Handwritten logs were often unclear, inconsistent, and difficult to analyze.

Zero Real-Time Feedback

Production data was not available in real time, causing delays in response.

No Root Cause Data

Issues were recorded without identifying or tracking their underlying causes.

"Manual data entry and paper-based reporting — a broken process. Result: misleading insights, poor planning, and hidden losses."

The Solution: Real-Time Monitoring, From Floor to Office

BEEDIGIT interface transforming complex factory data into visual hierarchies that connect overall productivity to individual machine performance
BEEDIGIT OEE dashboard displaying real-time equipment effectiveness metrics with color-coded performance indicators updating live
Array of BEEDIGIT production reports showing interconnected metrics across OEE, quality control, and machine efficiency in a unified interface
Simple touch interaction with BEEDIGIT's intuitive interface on tablet showing responsive design elements adapting to the device
BEEDIGIT's AI identifying downtime patterns across production line with automated root cause suggestions highlighted
BEEDIGIT's environmental impact dashboard converting energy consumption data into carbon footprint metrics with reduction targets
1

Real-Time Monitoring

A live supervisor dashboard shows line status and KPIs as they happen — no more waiting for end-of-shift reports.

2

Shift View & Historical Data

Losses are no longer abstract. Every loss is visible, traceable, and assignable to a specific shift, machine, or cause.

3

Operator Interface (Beedigit MES)

Operators log production directly into the system — no paper, no re-entry, no ambiguity.

4

Improved Process Control

Machine and process parameters are tracked digitally, enabling tighter control, less downtime, and better overall productivity.

5

Production Order Management

Automated order tracking minimizes human error and increases throughput across all 4 lines.

6

Drill-Down Line Performance

Supervisors can drill into OEE, downtime, output, and energy data — per line, per order, per shift.

See How Beedigit Works for Your Factory

The Results: From Paper Stacks to Live, Interactive Data

Supervisors can now monitor all 4 production lines from a single screen
Energy monitoring improved responsiveness to consumption issues
Traceability for internal audits improved significantly
Management now receives live KPI reports instead of end-of-shift summaries
Full visibility into production vs. plan, across every line

What's Next for Elsewedy Polymers

Connecting more of the four production lines for full-line coverage
Implementing APS
Integrating with Oracle WMS
Implementing Pulse Digital EAM (Enterprise Asset Management)

Ready to See This in Your Factory?